Blog
Combining Segments, Third Party Data and Modeling — A Primer
In my 30+ years of data-driven marketing experience, I can make the following statement with the utmost confidence: Combining customer segments, third party data and predictive modeling will significantly improve your marketing results. Most companies use one. Some...
Improve Under 65 healthcare Marketing
On March 23, 2010, then-U.S. president Barack Obama signed the Patient Protection and Affordable Care Act (ACA) into law. At the time, nearly 50 million people had no health insurance. As of 2023, roughly 40 million individuals now benefit from ACA-related...

Stated vs. Derived Importance in Key Drivers Analysis
Congratulations, somebody shopped in your store. Maybe somebody else will shop in your store, too. Or maybe they’ll shop in someone else’s store. Or maybe they’ll just say, “the heck with it” and go to a movie instead. Retailers keep us researchers...
Insurance Customer Acquisition Using Purchase Propensity Data
The foundation of successful customer acquisition is prospect data that targets consumers who are in the market to buy a specific insurance product. Too often, insurance marketers rely on simple targeting criteria such as age, income and gender. The use of this...
Increase Medicare Advantage Revenue By Reducing Member Churn
In the ever-evolving landscape of healthcare, Medicare Advantage plans face a critical challenge: member retention. With an average annual churn rate of 10%, health plans are losing significant revenue – as much as $120 million for a plan with 100,000 members....

Action Standards and Benchmarks for Better Results
Market research, like any investment in information, should demonstrate a clear return on investment (ROI). It should speak directly to a business need or opportunity that’s crucial to your organization, whether it’s for an immediate business solution or part...
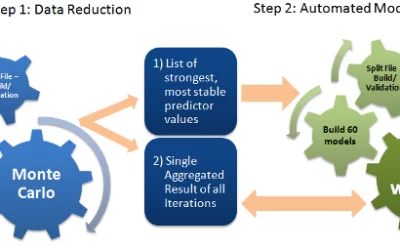
Predictive Modeling at the Speed of Business
Traditionally, data scientists build a single one-size-fits-all model to solve their business problem, or maybe several of them, one at a time. They never had the tools nor the computing power to let AI software automatically and intelligently build and evaluate...

Different Needs, Different Priorities
Share: This is the sixth in a series of findings from Data Decisions Group’s 2022 Medicare Preferences Study. We explore the differences in importance Medicare Advantage and Medicare Supplement members place on attributes of their respective plans. While important to...

Brand Loyalty among Medicare Supplement Providers
This is the fifth in a series of findings of Data Decisions Group’s 2022 Medicare Preferences Study. Here, we review brand loyalty metrics for providers of Medicare Supplement coverage. t is not terribly surprising that expectations of providers among the Medicare...
Brand Loyalty among Medicare Advantage Providers
This is the fourth in a series of findings of Data Decisions Group’s 2022 Medicare Preferences Study. Here, we review brand loyalty metrics for providers of Medicare Advantage coverage. In Article #5, we’ll look at the same information among the major providers of...
3 Important Reminders—Data security & Email
Data security is a phrase that seems to be on everyone’s lips these days, with a news report about the most recent breach of customers’ personal information seeming to pop up almost every week. In the marketing research industry, where companies handle the personally...